How to Enhance Business Reporting with Hotmob’s Custom Data Visualization Services
Jun 28, 2023
Why is data visualization beneficial to businesses?
Data visualization has been widely used across various industries allowing businesses to transform data into useful information to extract business intelligence. Meanwhile, a dashboard provides a consolidated view of important metrics and key indicators that are related to a specific topic or business process. Hence allow users to identify key trends and insights to facilitate their decision making and improve performance of a campaign.
A challenge that most small and medium businesses face when building a dashboard for their needs is the lack of accessible data source, expertise and the required technology to comprehend a large volume of data efficiently, as it often comes with great costs and consumes time.
Why create a custom dashboard?
In comparison to a standard dashboard which is based on primary data, a custom dashboard offers flexibility to edit and adjust to the needs for business objectives and can be tailor made for different users or business units.
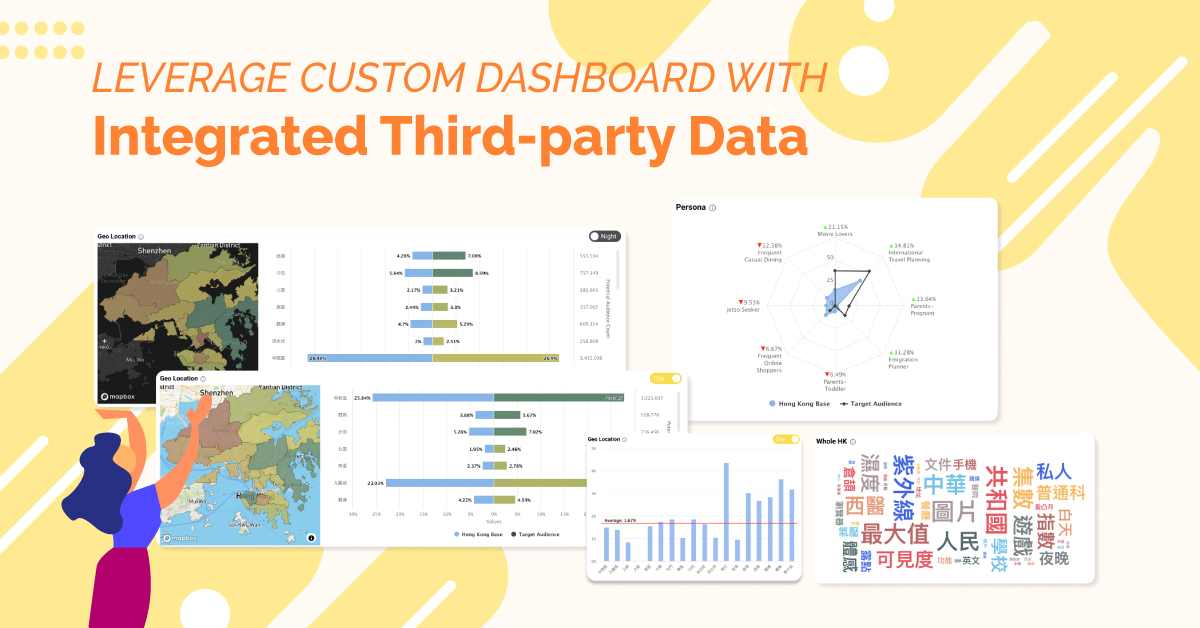
Most importantly is that external data can be adapted in a custom dashboard to compare with a business’s internal data. Having an external benchmarking can help businesses identify trending products or hot topics that are becoming popular within an industry. This implies businesses can gain more valuable insights than relying on its own data for a complete view of the needs and demand of the market.
What values can Hotmob bring to businesses?
Businesses can benefit by using less time looking through datasets for information that drive business decisions, because Hotmob has the expertise and experience of managing and analyzing big data, in addition to advanced technology and data capacity.

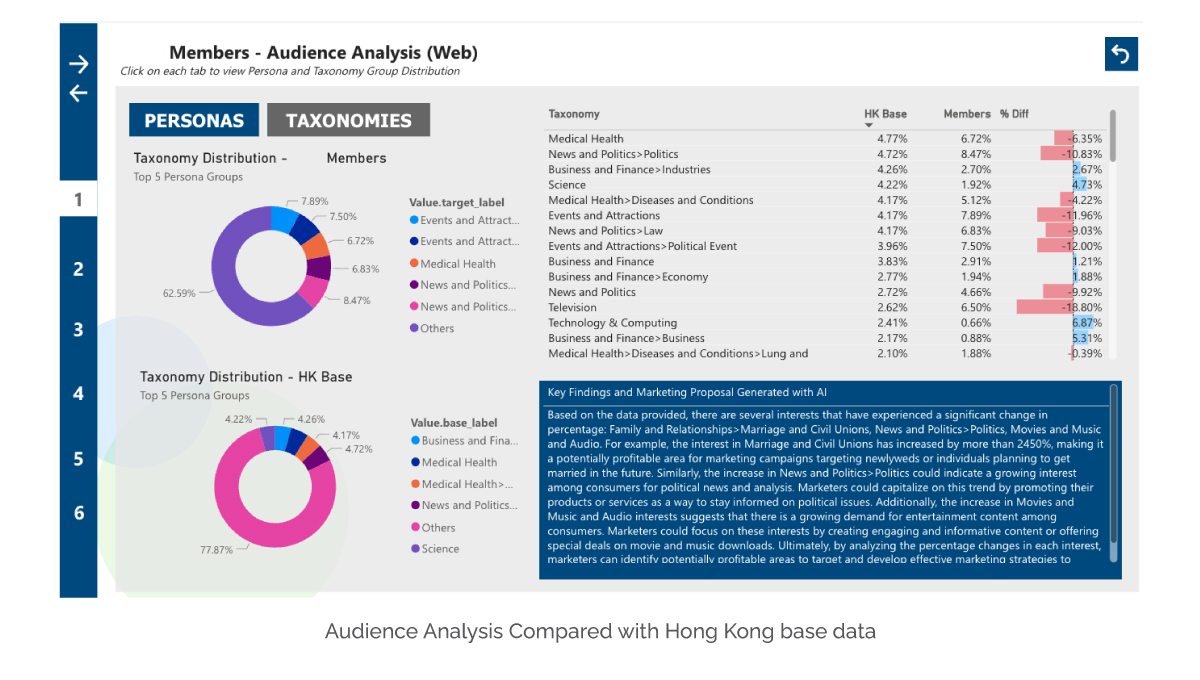
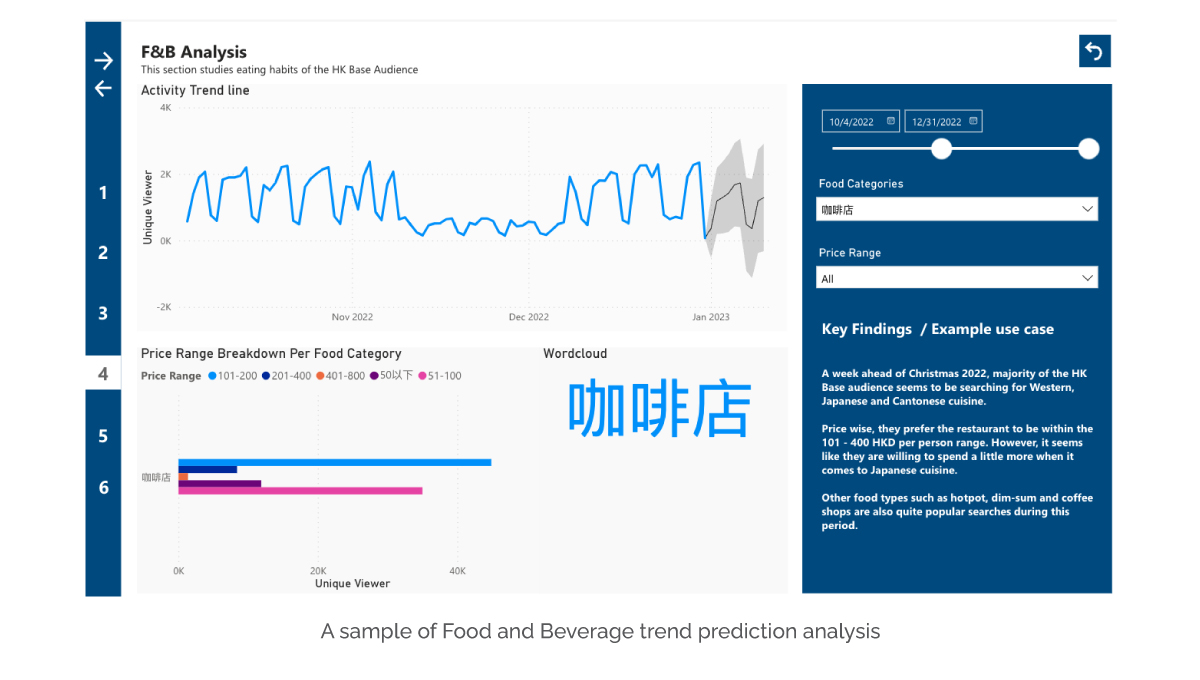
Users can rely on Hotmob’s Data Visualization services to generate competitor analysis, market analysis, or trend prediction, and transform them into a data visualization dashboard for different teams or business units’ usage. Moreover, businesses can match and compare internal data against Hong Kong base data to gain a high-level perspective into key indicators and trending topics.


What do you get from Hotmob’s Data Visualization Services?
Experienced data visualization engineers and data scientists
Business strategy planning and business use case creation
Accessible external data for market analysis and trend prediction
Businesses are reassured to be backed up by Hotmob’s Data Team to extract meaningful insights and findings from a custom dashboard.
Contact us for more information or let us know your thoughts.